


This post was co-authored by Doug Laidlaw, Director, Business Operations & Analytics.
At DCL Logistics we stay agile by frequently looking at data to track industry trends. Our analysis is used to forecast and anticipate customer needs accordingly.
Looking at data from 2020, a year of so many twists and turns, we see the volatility and unpredictability of the year reflected in our data. As we head into the holiday season, there are a few interesting highlights that we notice.
Carrier Shipping Times Look (Mostly) Back to Normal
All domestic carriers experienced shipping delays during 2020. With the shelter-in-place rules, ecommerce sales went up significantly. Carriers were overloaded without enough notice to absorb the impact.
Predominantly all carriers saw a slight rise in the average delivery times in March and April, when the shelter-in-place orders were instituted around the country. Though these numbers seem small, to have the average shipping time go from two days to three, is quite a lot when you consider how many disgruntled customers that includes.
We’ve pulled month over month data on carrier shipping times by average days in transit.
Looking at the data in September of this year, leading into the holiday rush, most average ship times have leveled off, or lowered. And when compared to the same month in 2019 the numbers seem similar to a “normal” average ship time. All carriers have announced proactive measures to manage high order volumes this year, but they’ve all also said they won’t guarantee any ship times. Carriers are warning customers to expect delays as they are forecasting a record breaking surge in ecommerce volume. At DCL we’re urging our customers to be proactive to limit shipping delays: incentivize early shopping, communicate shipping cut-off dates to end-customers, keep carrier forecasts updated frequently, and have a solid contingency plan.
Consumer Spending is Way Up
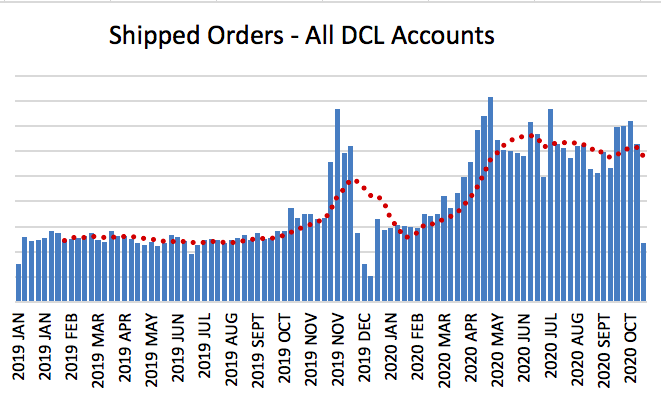
2019 data shows a very typical cadence of shipping order volume. Numbers are steady throughout the year with a very clear spike around the holidays.
Looking at 2020 data, there is a clear marker when the pandemic shutdown happened. With social gatherings cancelled, brick-and-mortar stores shuttered, plus work and school from home the norm, online spending and buying skyrocketed.
The high order volumes across 2020 are unprecedented. We see overall order volume up 95% in Q3 2020 when compared to Q1 of this year. And it’s up 148% compared to Q3 of 2019. Each spike during the March-October 2020 span is almost as great as the singular 2019 holiday spike. Predictions are that November is going to get really big this year.
Sales Spikes by Industry are (Somewhat) Surprising
A lot of industries have been impacted by COVID, whether it’s brick-and-mortar shops closing, or health related startups booming. Here’s what we’ve seen so far from our internal data.
Consumer Electronics (B2C)
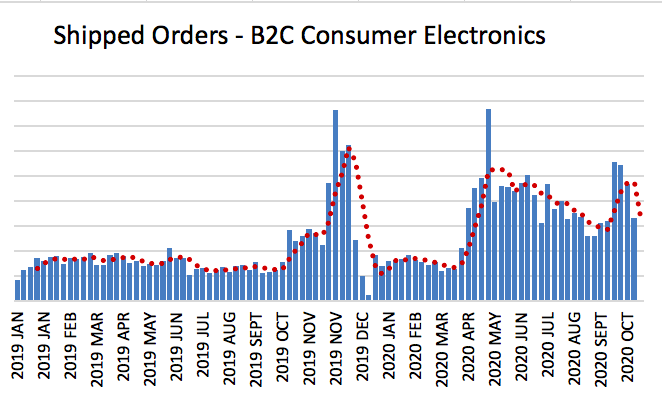
Surprisingly enough the B2C consumer electronics industry has seen high sales volume throughout most of 2020. Starting around May of this year, our shipped order volume has remained almost as high as a typical December (as shown in the 2019 December columns). We’d guess people were buying entertainment devices for themselves and their families, while spending more time at home together.
In Q3 2020 consumer electronics order numbers are up 195% when compared to order volume in Q3 of 2019. We see 155% increase when compared to Q1 of 2020 (pre-pandemic).
Health & Beauty (B2C)
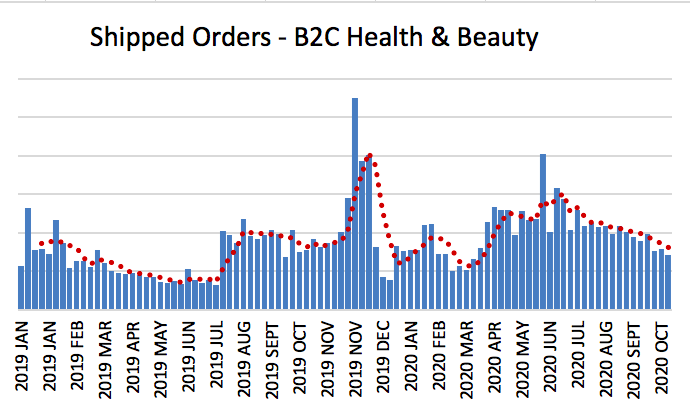
In 2019 the data shows an obvious spike during cyber week and the holiday sales rush.
2020 shows a similar “holiday” spike happening now in October, but the real difference is the high sales numbers in May of this year. Health and beauty order volume is up 25% in Q3 of 2020 when compared to Q1 of this year. Mostly it’s likely due to the purchase of health care and devices like smart thermometers and hair trimmers, but it could also be that people got really into their self-care routines a few months into the pandemic. Without salons, spas, or gyms to go to for health and beauty products and services, the trend was to get the same products for at-home treatments.
Enterprise Hardware (B2C)
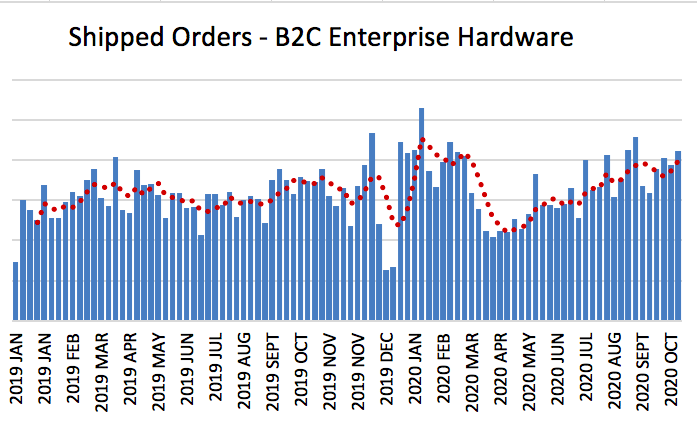
Typically a very steady order volume, enterprise hardware companies have seen slight drops in sales during the pandemic. Likely there is less purchasing happening for corporate offices, and more individual sales for working-from-home. It’s also been reported that with far fewer people in office buildings, companies have invested in more security cameras and sensors to keep low traffic areas safe. Warehouses and the transportation industry are also likely responsible for the climb in numbers here, post pandemic shutdown. They have been working overtime since March and have amped up their reliance on smart hardware like asset tracking devices, GPS, temperature monitors, and more. It’s all liked back to more individuals purchasing all their needs online, and the infrastructure that needs to support that.
While enterprise hardware hasn’t skyrocketed like other industries, year over year order volume has increased 19% when comparing Q3 2019 total orders shipped to Q3 2020.
Conclusion
We’ve gleaned a few standout things from our data this year. First, 2020 has been wholly unpredictable and a bit chaotic. Second, staying on top of carrier ship times will be invaluable for great customer service during the holiday rush, and into 2021. Third, these variations by industry are a great reminder to always take a proactive stance when developing fulfillment strategy—you never want to get caught with huge demand and no plan to meet your growth.
This holiday season is already on track to be bigger than ever. Mostly what we see when we look at this data, is that 2021 will likely be another year of surprises; there’s no way to predict what will come after a year like this.


